 An earlier version of this article was published in NIRI’s IR Update magazine.
Exponential growth in the raw data available for analytics will only be accelerated by artificial intelligence (AI), amplifying both the opportunity and the challenge for investor relations (IR) professionals and corporate management teams. Many companies are still struggling to understand what it means to be prepared for an AI world. How can AI insights be integrated with decision-making throughout the organization?
In this article, I review the AI-driven data deluge, outline the capabilities needed to distill voluminous data into actionable insights and explore why harnessing these insights in IR requires not just advanced analytics, but a disciplined process and effective storytelling.
AI in Investor Relations Adds to a Data Deluge
In many ways, AI is just the latest in a series of technological developments (ranging from data storage to computer hardware architecture advancements) that have laid the foundation for exponential growth in data generation, storage and analysis. The size and scope strains comprehension:
- Approximately 15 billion Internet of Things devices were online as of 2023, a number expected to reach nearly 30 billion by 2030.
- There are 5.3 billion internet users worldwide. This is expected to reach 7.9 billion by 2029.
- 90 percent of all the data generated in the history of the world was in the last two years alone.
Financial services firms are increasingly using this unprecedented supply of data to predict business model outcomes and set equity prices. But while we continue to hear these statistics, it can be all too easy to overlook the novel discipline required to actually integrate this scale of data with IR and management decision-making processes.
An estimated 80 percent of the data collected by 2025 will be unstructured, and the right tools and skills are critical to unlocking the value of this data. These are five of the most critical:
- Business knowledge of where value is created for the end customer.
- The devices and sources of data and their biases.
- Statistical and mathematical approaches to calculating what is known, and properly derisking what is not.
- Technology software and architecture requirements.
- Cultural and organizational awareness and mutual respect for blending those respective skills into tangible workflows.
The Importance of Storytelling
Even with advanced technology that can synthesize and deliver data in actionable formats, further context and understanding remain fundamental. As Nobel prize winners Daniel Kahneman and Amos Tversky were quoted as saying in the book The Undoing Project by Michael Lewis, “No one ever made a decision because of a number. They need a story.”
During studies of even highly educated, scientifically disciplined doctorates in medicine and statistics, Tversky and Kahneman found most people rely on mental heuristics (habits) including availability, representativeness and anchoring. Their research indicated we are prone to using recent availability or representativeness of personal experience to extrapolate probability, and our expectations can be anchored by the order in which we receive information: a humbling and troubling proposition. Today, coupled with the birth and global domination of software, we increasingly look to technology for answers to protect us from misjudgment.
Building on Kahneman and Tversky’s research, psychologist Paul Slovic decided to evaluate the effect of information on decision-making. He gathered a group of professional gamblers and tested them with horse races over four rounds.
Slovic told them the test would consist of predicting 40 horse races in four consecutive rounds. In the first round, each gambler was given five pieces of information about each horse. One might believe years of jockey experience was a key performance indicator (KPI); another might want horse top speed; and so on.
The results? Providing expert gamblers with double the number of “KPIs” dramatically inflated their confidence — but failed to make an impact on the accuracy of their predictions! This outcome has significant ramifications for our ability to use raw information, with an eagerness to confidently employ new data often driven by fear of missing out and untested assumptions.
How can IR professionals establish processes that drive more powerful, investor-centric storytelling? We take a deeper look in our article on “What Investor Relations Can Learn from Marketing.”
The Humble OODA
Thankfully for those with humility and a desire to drive consistent outperformance, the concept of feedback loops has emerged as an increasingly prevalent solution to digest and filter the mountain of data resources available today. Indeed, even the U.S. military has embedded feedback loops in their foundational doctrines in the form of legendary tactician Jon Boyd’s OODA loop: Observe, Orient, Decide and Act.
Regardless of the precise context, this doctrine suggests that whoever is able to consistently and accurately execute the following steps will emerge victorious:
- Observe (ingest data)
- Orient (solve for primary KPIs)
- Decide (designate the primary objective)
- Act (ability to execute)
- Iteratively return to the first step to observe the success or failure of the previous effort.
Teams cycling proactively through this framework will win while opponents are lost in the noise and confusion of exponential information growth. Process matters! Unless IR professionals have a disciplined, consistent process with feedback loops, they risk being guilty of simply cherry-picking data to deepen confirmation bias, leaving us potentially wrong and falsely confident about it.
A Sample Feedback Loop for Integrated Insights
How can we integrate qualitative and quantitative inputs into shared intelligence? The chart “The Fusion of Data, Discipline, and Technology” below, shows how an asset management group might add specificity to an OODA loop concept, driving decisions on which allocations to purchase, how they integrate as a portfolio and how to assess attribution and error rate per input function step, a historical “holy grail” challenge.

On the left, we have inputs such as SEC filings, internal or external analysis, industry relationships and qualitative experiences. In the next column, there are functions within systems that will change through manual or automated updates to reflect the changing reality of the world around us. These input names may change based on the business model, but for financial services groups, this category drives top- and bottom-line changes to forward estimates and areas we believe to be operational key performance indicators for the asset-related business model.
These inputs are then reviewed based on portfolio risk parameters that may be as simple as a gut feeling or as complex as mathematical factor models. These steps culminate in a buy or sell decision, and then the forward performance of the asset begins to show actual outcomes.
If our effort has been recorded, the magic begins. We can check our initial assumptions against actuals and run feedback statistics, error rates and increasingly complex machine learning algorithms in real-time, constantly growing resources of training data and intellectual property. This ongoing process effectively allows data and institutional learning to become tangible assets — and can be readily adapted to a corporate IR setting.
Turning Questions into Predictions
The shift to analytics and data-influenced decisions will likely be one of the largest shifts in IR team discussions over the next five years. To navigate this transition, IR teams must take qualitative, thematic questions and connect them with concrete KPIs — hypotheses that can be quantified, tested and predicted. This process entails integrating the personal experiences of business users and operators and attaching their primary metrics to consistently available data. While AI will introduce new opportunities and capabilities for this process, the fundamental challenge will remain the same.
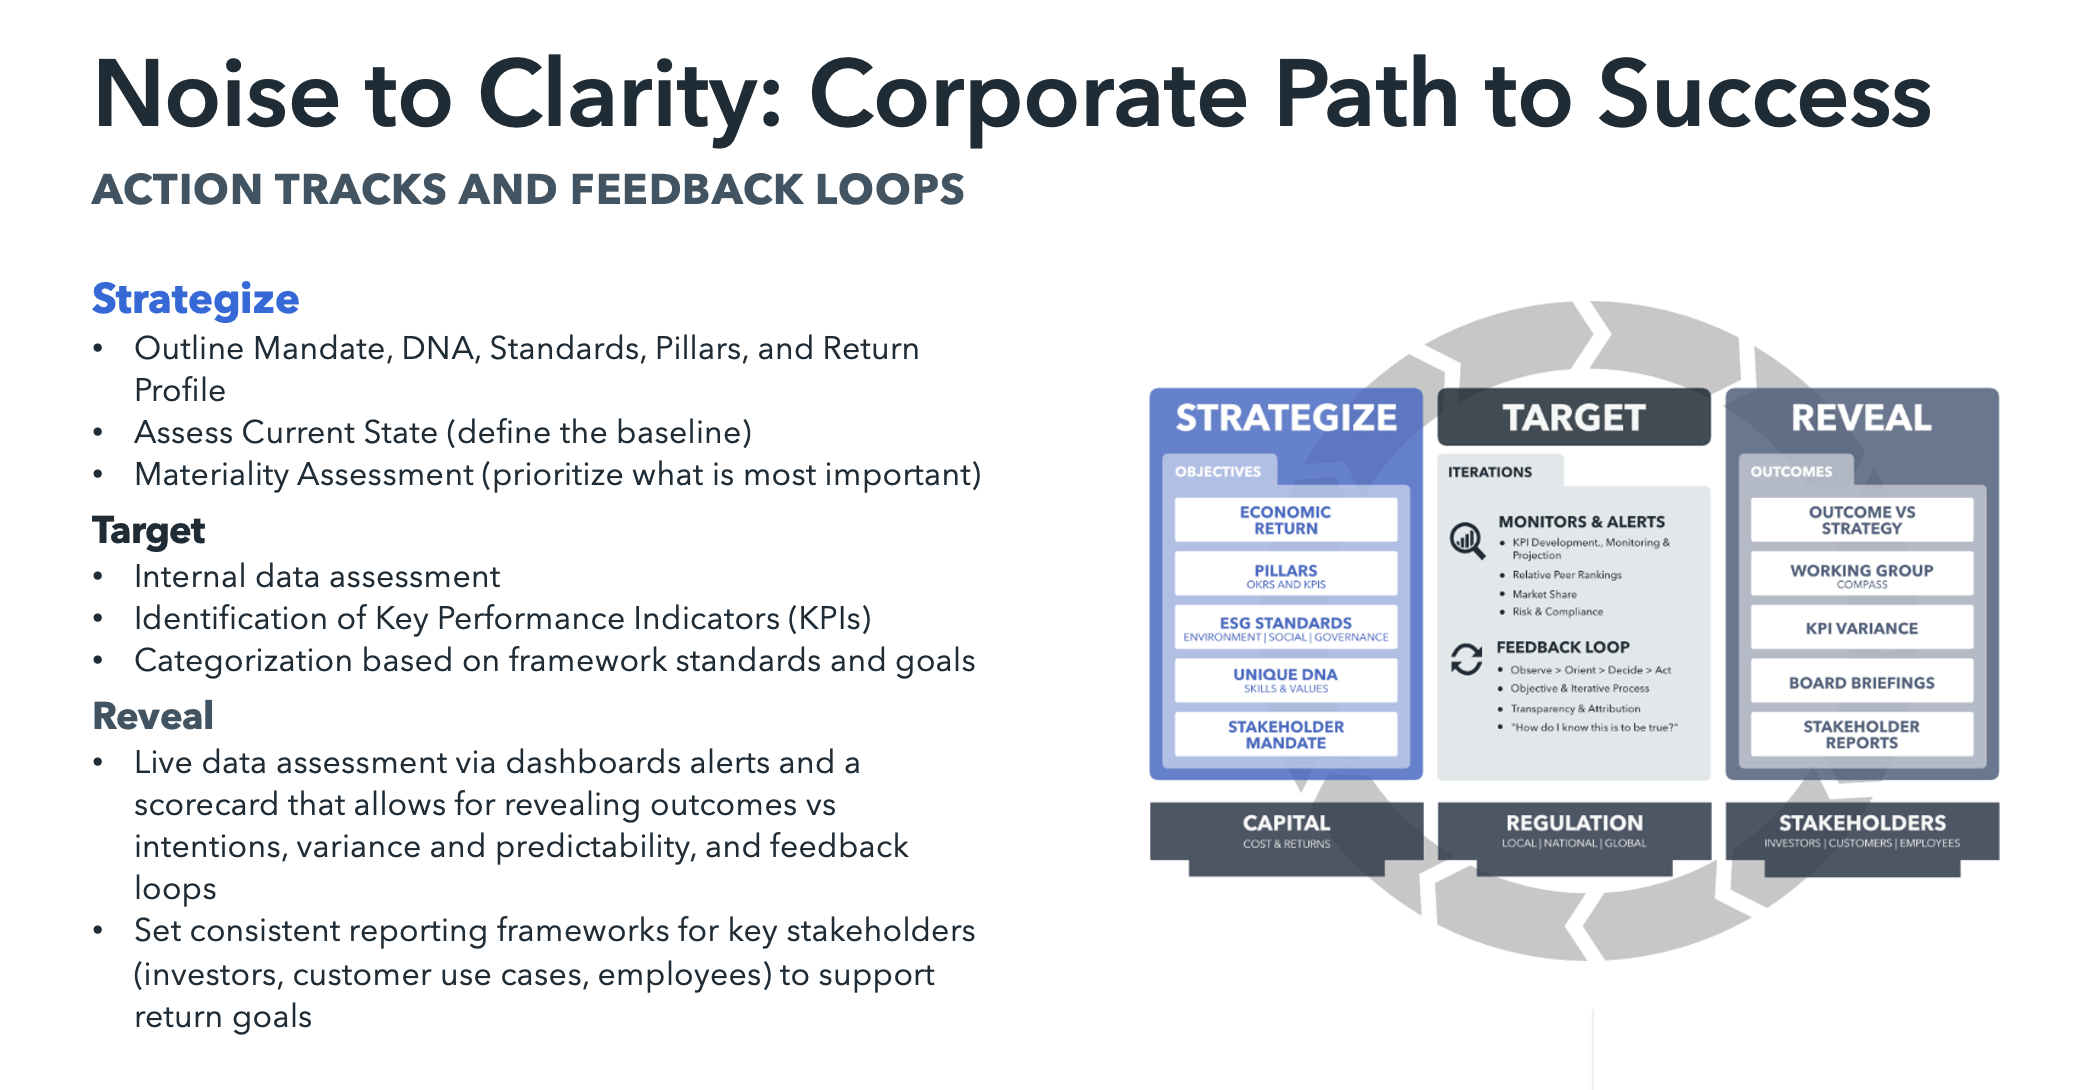
In the context of investor relations, the following three action pillars can provide a helpful foundation for conceptualizing and refining a strategy for leveraging AI to provide greater clarity (and not just add to the noise).
- Strategize about what you would like to see in the future.
- Define a set of targets by which you will judge the health of your efforts.
- Establish a reporting and review process that serves as the basis of an ongoing revelation feedback loop that will support a true learning organization.
Working through the “how” of these fundamental process questions will organically guide the required budget, data and technology integrations, shaping a process that is more efficient and materially cleaner for key stakeholders.
Absent this high-level strategy, efforts to incorporate AI and other novel data sources can devolve into siloed initiatives and piecemeal vendor relationships. It can be all too easy to focus on which new technologies to acquire and which advanced new AI capabilities to pursue. But years of work and millions of dollars of investment toward achieving a data-driven organization can go to waste if this data is not thoughtfully woven into decision-making processes.
Effective AI-driven insights also need to be shaped to reflect the KPIs that are widely employed by analysts (and thus critical for valuation in a market increasingly influenced by quantitative investors). For example, analysts might answer questions about a company’s equity value by inferring revenue growth based on KPIs such as new customer growth, average spend per transaction, share of industry sales and cohorts changing purchasing locations between physical and virtual storefronts. These may be derived from transaction records, email receipts, web traffic or natural language processing queries of customer social media comments.
Corporate intelligence and investor relations groups are likely to be a vital bridge between planning for resource allocation and explaining these novel components to stakeholders to answer the fundamental question “what is driving the stock?”
What is Driving the Stock?
Here we are going to tackle one of the holy grail interest points across stakeholders: why is a stock trading where it is?
Common valuation factors such as EBITDA, Return on Invested Capital and Wall Street analyst ratings can be incorporated into risk model factors from Barra or Axioma, tools that effectively provide mathematically calculated relationships with certain thematic styles such as growth, value, leverage, size and others.
These advanced analytics solutions can be readily analogized to nutrition labels. The impact of a food (or asset) really depends on its constituent macronutrients. Using factor analysis, we can decompose what is driving asset pricing similar to how we can deconstruct a soup into nutrition macros such as protein, carbohydrates and fats.
The chart below compares a company to a group of its peers. While the stock was down 8.19 percent in this example, style factors negatively impacted its peer group by 25.93 percent, and the company actually recovered 17 percent due to company-specific tailwinds. Fundamentally, we can see that EBITDA margins and growth have an 84 percent correlation to stock price, demonstrating explicitly what shareholders care about most, with powerful ramifications for capital allocation decisions.
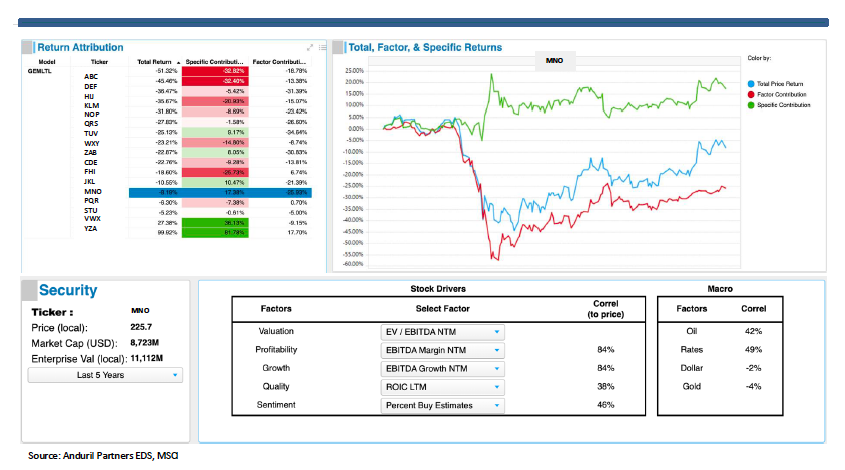
Factor and Fundamental KPI Analysis Example
This knowledge can prove extraordinarily powerful when meeting with management or shareholders, providing explicit and empirical answers backed by exact correlations revealing whether the stock has been most influenced by topline growth or margin expansion. This insight adds tremendous granularity when coupled with equity owner investment discipline criteria or management capital allocation planning for M&A, buyback or dividend policy.
Water, Water Everywhere, Yet…
We have discussed use cases in several components of a decision workflow, but there are many others, and everyone weighs them differently for different durations. In this context, how do we blend all these inputs of different types into a system with feedback loops?
The “Tower of Babel” of decision inputs illustrated below will simply not scale using traditional tools like Excel and PowerPoint. The difficulty is that data comes from different sources, speaking languages including near-term and long-term fundamental business model KPIs, technology requirements, math and data science integrity, historical and peer valuation and risk factor influences.
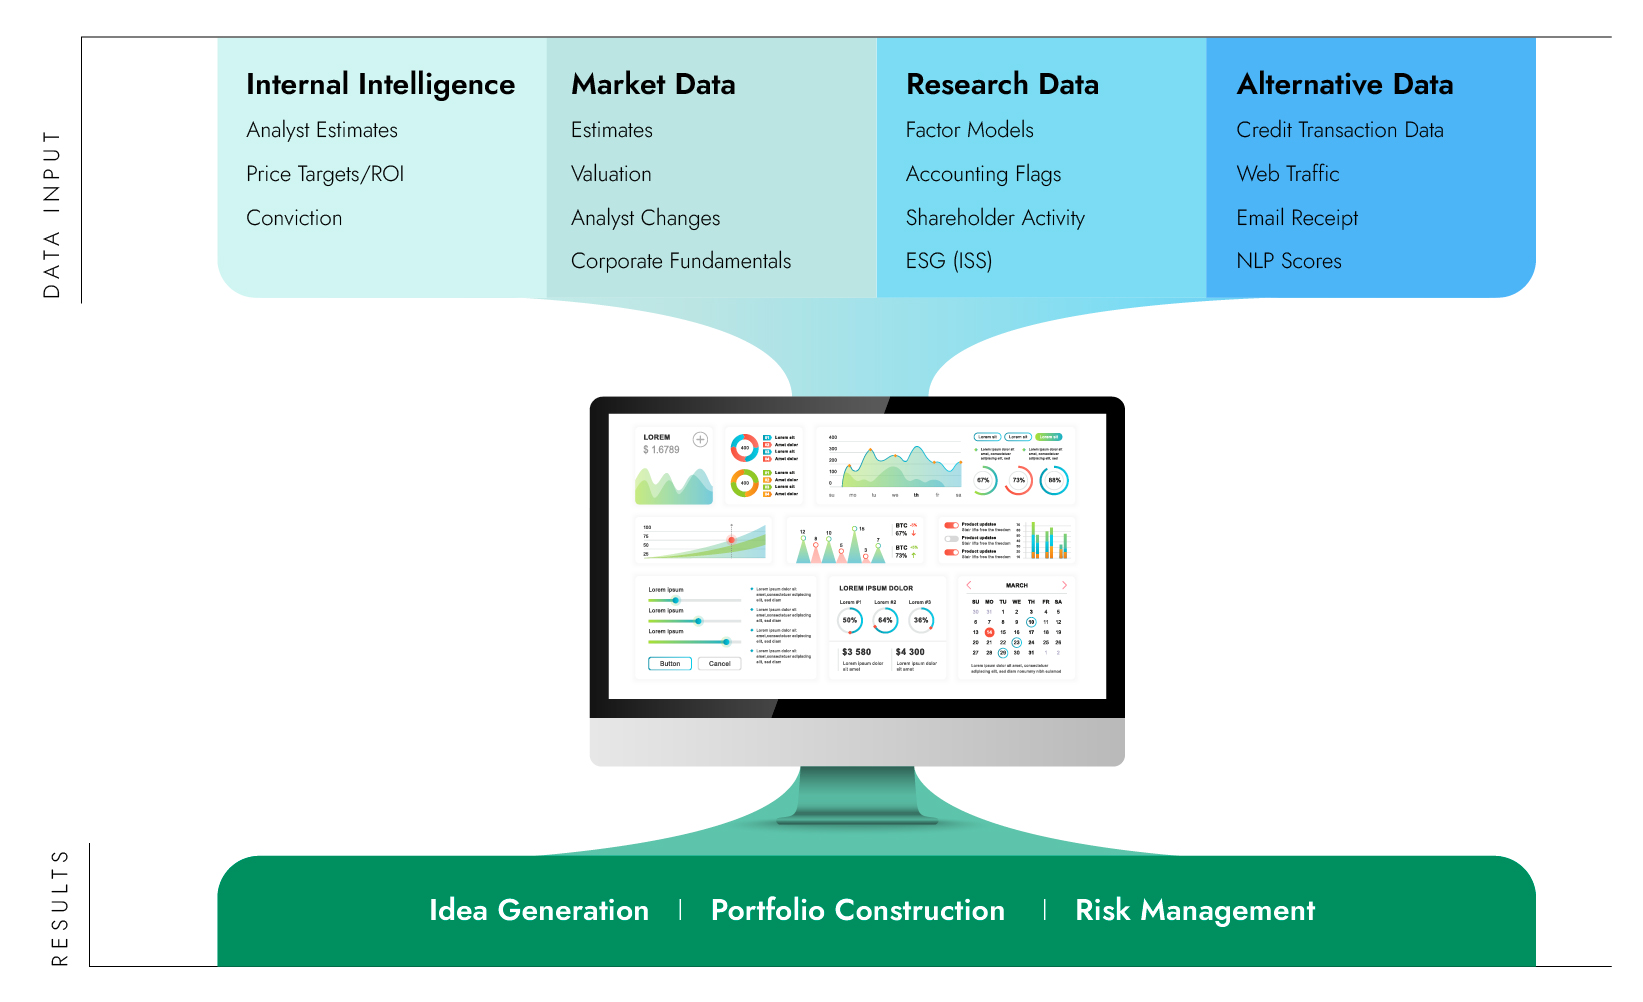
A Tower of Babel: Qualitative and Quantitative Inputs
There are several critical challenges here:
- These inputs are like trying to compare apples, oranges and pears.
- Per our example on the horse races, academic research shows after a certain level of inputs, information-overloaded analysts flatline their predictive ability.
- There are almost no transparent or consistent feedback loops without a software system for tracking and monitoring. We love to talk about ML/AI opportunities, but those don’t exist until one has the data in a system with feedback loops.
For those interested in taking tangible steps to address these challenges, there are growing options to leverage both technology and qualitative business acumen using process-driven software. Integrating corporate intelligence and financial workflow decisions with inputs from fundamental business model views, statistical probabilities, real-time nowcast data, internal analysis and risk management, this software provides a robust launching pad for generating investor relations insights targeted at an organization’s most pressing challenges.
A Disciplined Process for Generating Investor Relations Insights
Ultimately, the keystone of an effective decision-making process is not voluminous or novel data, but a team that understands how to generate effective hypotheses, employing data and AI to “see the forest for the trees” and answer the questions that matter most to management — and investors.
Scaling up the in-house analytics capabilities, disciplined evaluation process and iterative “feedback loop” needed to effectively engage with tough valuation challenges is a resource-intensive endeavor that is out of reach for many IR teams. Arbor Advisory Group’s partnership with Anduril Partners is designed to help. Providing detailed, highly digestible intelligence on how various market factors are impacting company share price, Anduril employs proprietary software and a number of different analytical approaches, including covariance modeling and other complex statistical work.
The example screenshot below illustrates the insights this modeling work can deliver, including KPIs relevant for integrating longstanding financial priorities (like valuation, relative growth, profitability, quality and sentiment) and emerging priorities (like ESG scores) right into readily digestible reports. Determining the precise impact of various KPIs on stock performance allows for an apples-to-apples comparison of diverse strategic considerations. Moving forward, this analysis can be iterated as needed to assess progress, evaluate stock performance and continue to guide the future direction of IR strategy while providing a robust feedback loop capable of integrating new insights from novel sources such as AI.
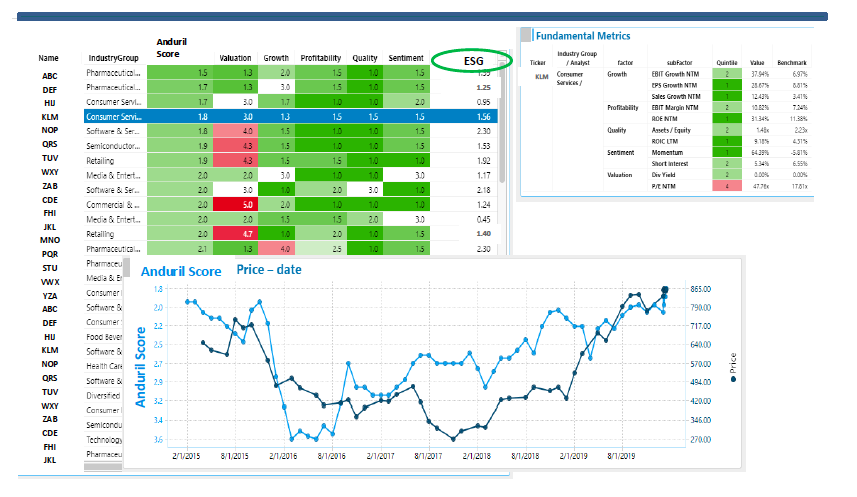
Example: Comparing Fundamental Valuation Metrics Across Peer Companies
AI-driven insights will have their greatest impact on investors and analysts if they are part of a cohesive long-term narrative about the company and its unique capacity to generate value. Rather than present a laundry list of data to analysts with instructions on how to interpret it, the most effective IR strategy will seek to use data to directly address investors’ front-of-mind concerns, incorporate their feedback and iteratively tune both strategy and IR communications to keep pace with changing investor sentiment.
Arbor Advisory Group begins by engaging the management team to identify strategic priorities, leading indicators, and objectives. From there, we work to develop a strategy for revealing these long-term priorities to investors and inviting them to become part of the company’s journey. From SEC filings to investor days, a clear and scalable process for incorporating new insights from AI is the key to achieving our end goals: cut through the noise, turn boundless data into cohesive causal narratives and deliver concrete insights into pressing IR challenges such as understanding and addressing valuation gaps.
We invite you to learn more about IR 2.0, Arbor Advisory Group’s differentiated approach to data intelligence for IR, here.
*All images sourced by Anduril Partners.